Managed Linux Server Monitoring: What's Included
Managed server monitoring built on Grafana, Prometheus, and Loki. We run the stack. You watch your servers.
One-Command Setup
After signup, run a single curl command on each server you want to monitor. Grafana Alloy installs automatically, connects to our stack, and your dashboard is live within 60 seconds.
Supported: Ubuntu, Debian, RHEL, CentOS, Fedora, and most systemd-based Linux distributions. No SSH access required from our side. Ever.
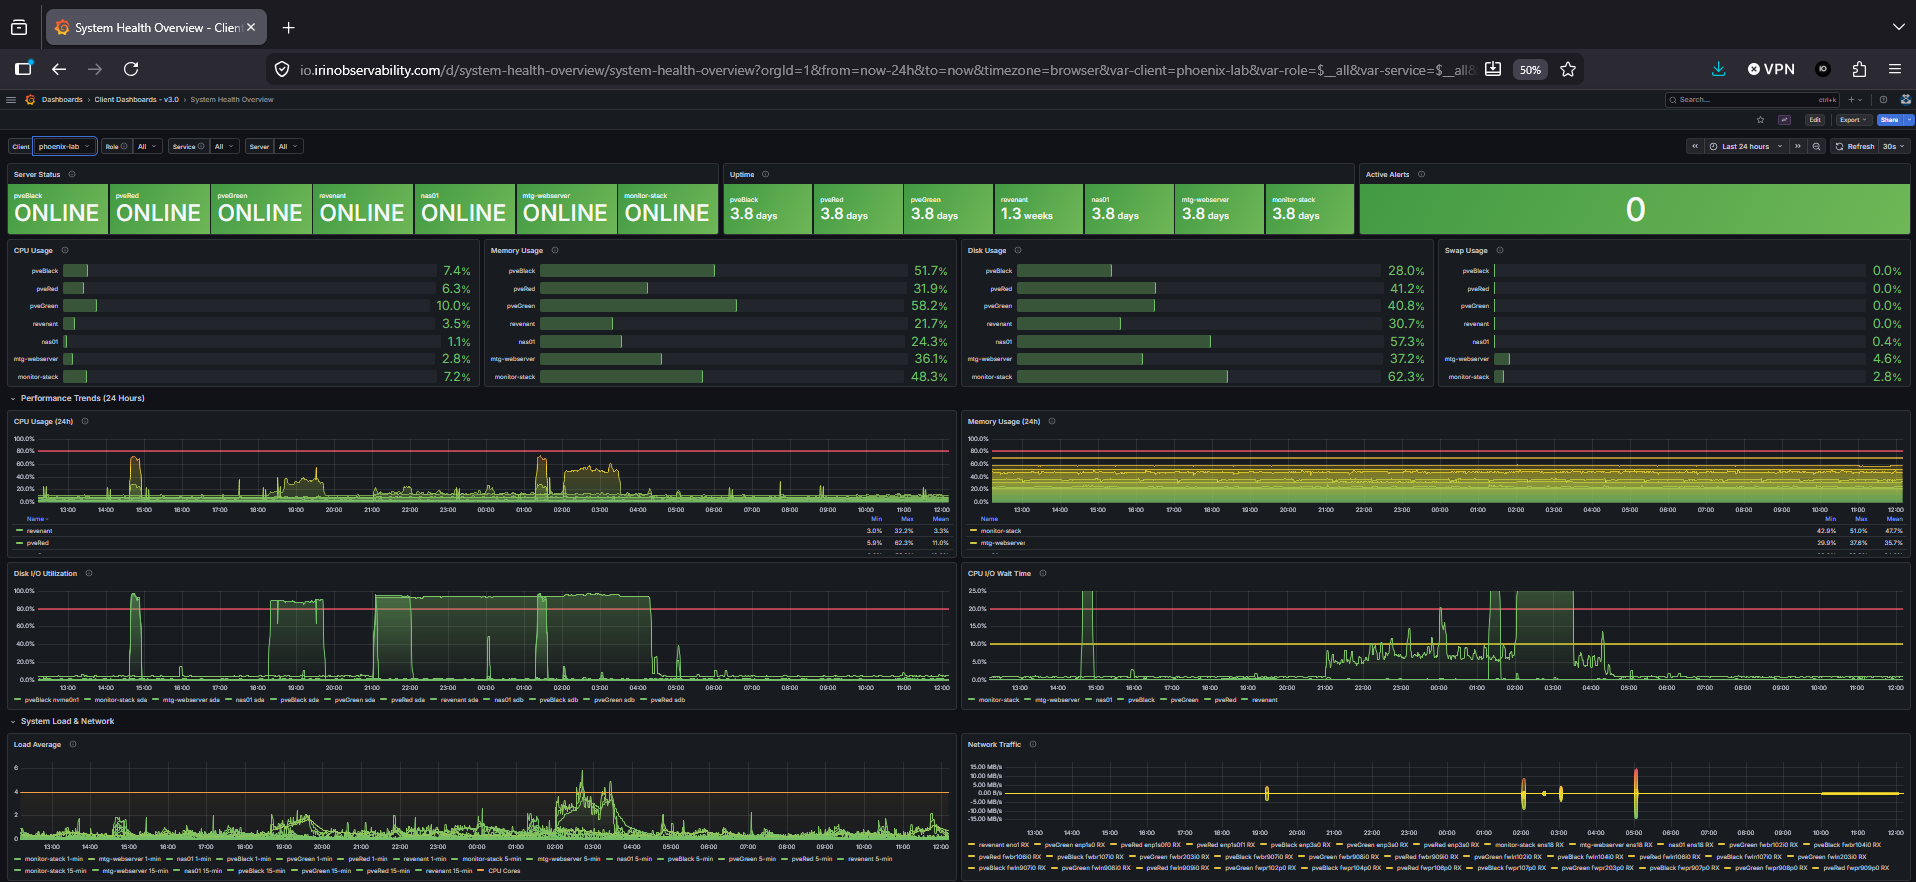
Your Dashboard
Every server gets CPU, memory, disk, and network panels. Log Explorer lets you search across all your servers in one place. Alert History shows you what fired and when.
Access: Your Grafana dashboard is available 24/7 at io.irinobservability.com. Your data is isolated; other tenants cannot see your servers.
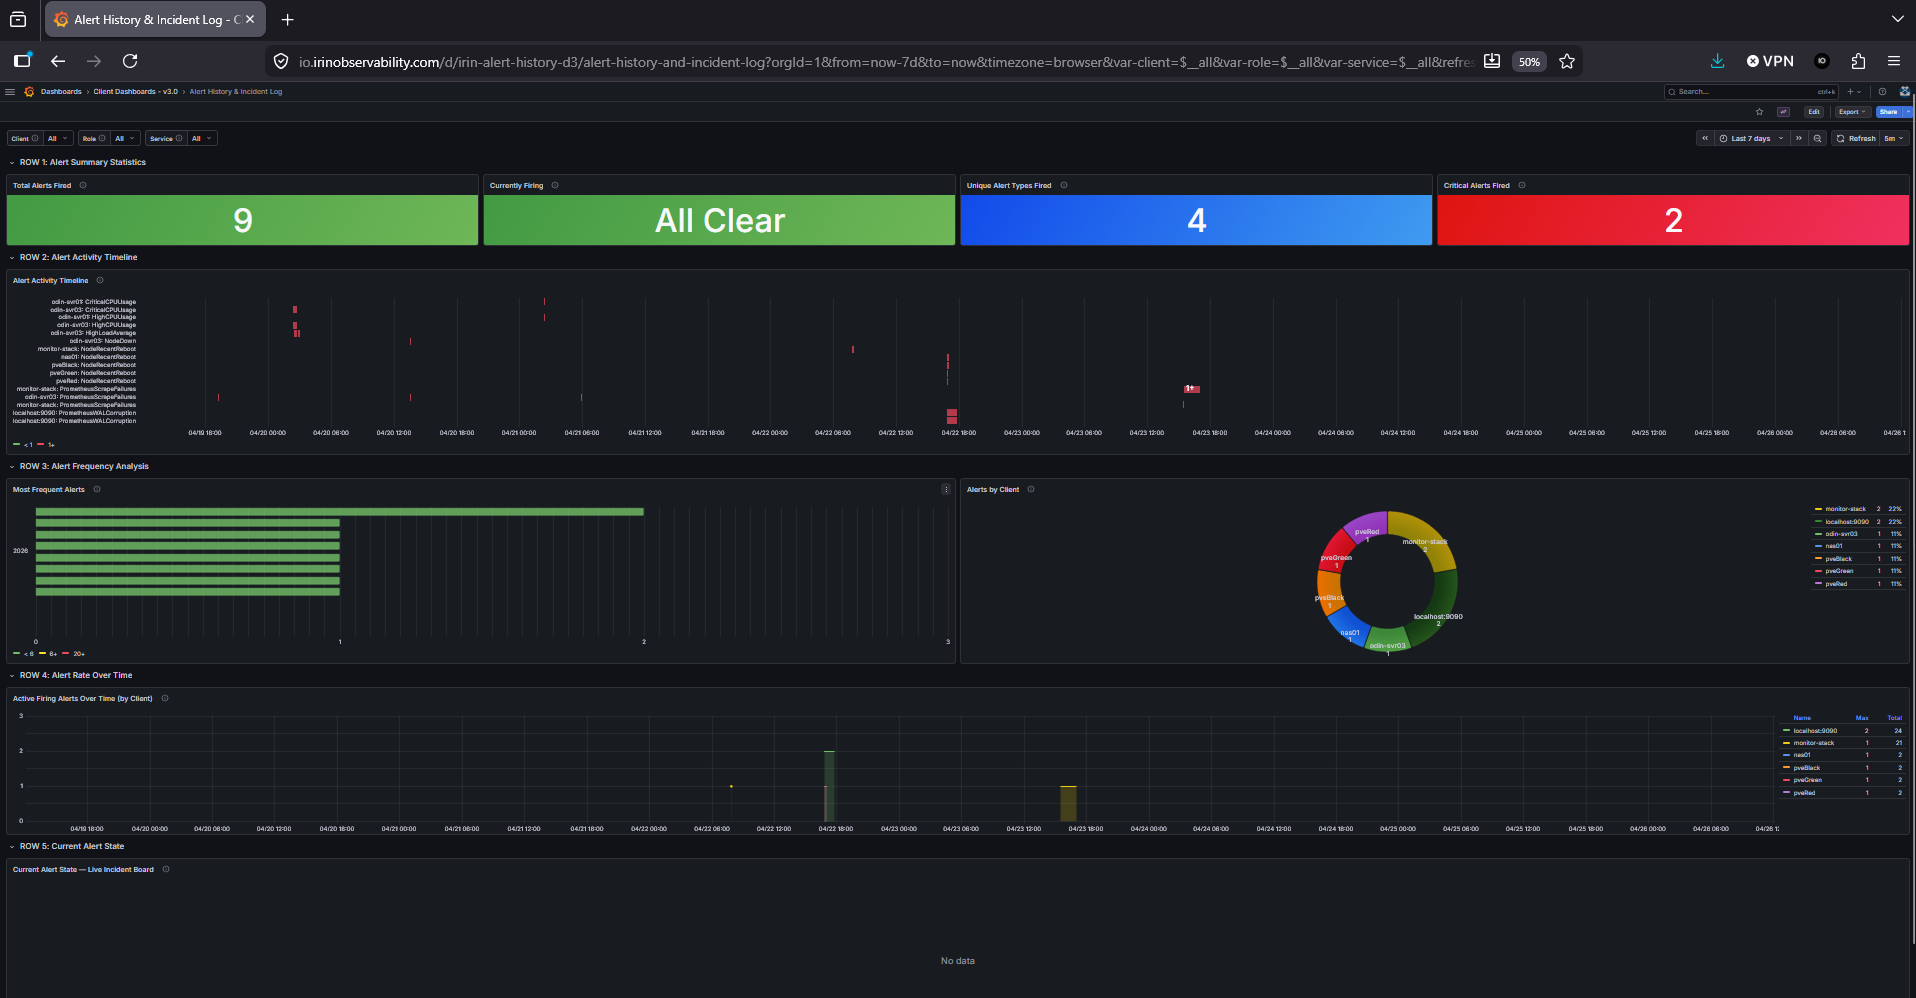
Alerts That Mean Something
Pre-tuned alert rules covering high CPU, memory pressure, disk fill rate, service failures, and more. Alerts are reviewed and adjusted, not just default thresholds copied from a template.
Delivery: Slack and email alerting available on paid plans.
Monthly Reports
Paid plans include a monthly infrastructure health report delivered to your inbox: uptime summary, alert history, capacity trends, and recommendations. Something you can actually hand to a manager.
Container Monitoring
Running Docker? Paid plans automatically detect Docker on your servers and install cAdvisor (Google's open-source container metrics tool) to surface per-container CPU, memory, and network usage alongside your host-level metrics.
Note: cAdvisor is installed as a Docker container on your server. See our Terms of Use for full agent installation disclosure.
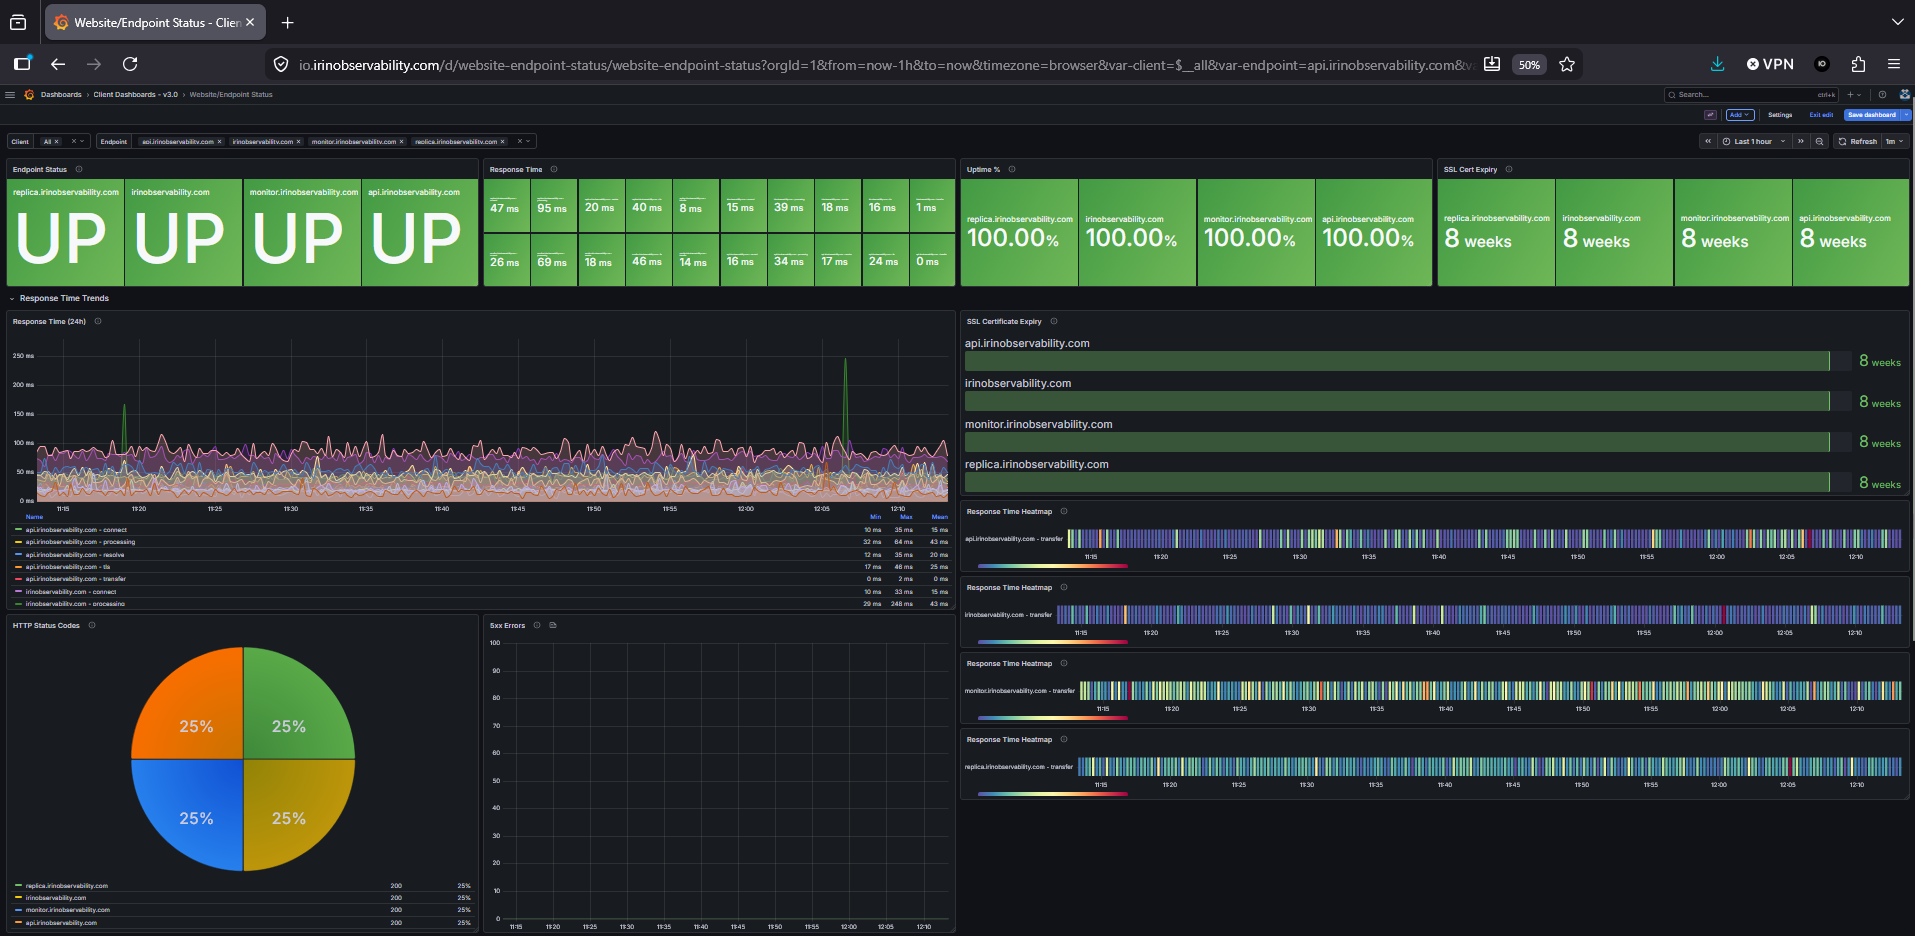
Website & Endpoint Monitoring
Paid plans include HTTP endpoint monitoring for your public-facing services. We probe your URLs at regular intervals and alert you when something stops responding or returns an error.
Simple, flat-rate pricing
Free tier for up to 3 servers. Paid plans from $75/month, with all features included, no per-server fees, no surprise invoices.
See Pricing →