How three-layer tenant isolation works without dedicated infrastructure per client
April 28, 2026 · By Justyn Larry
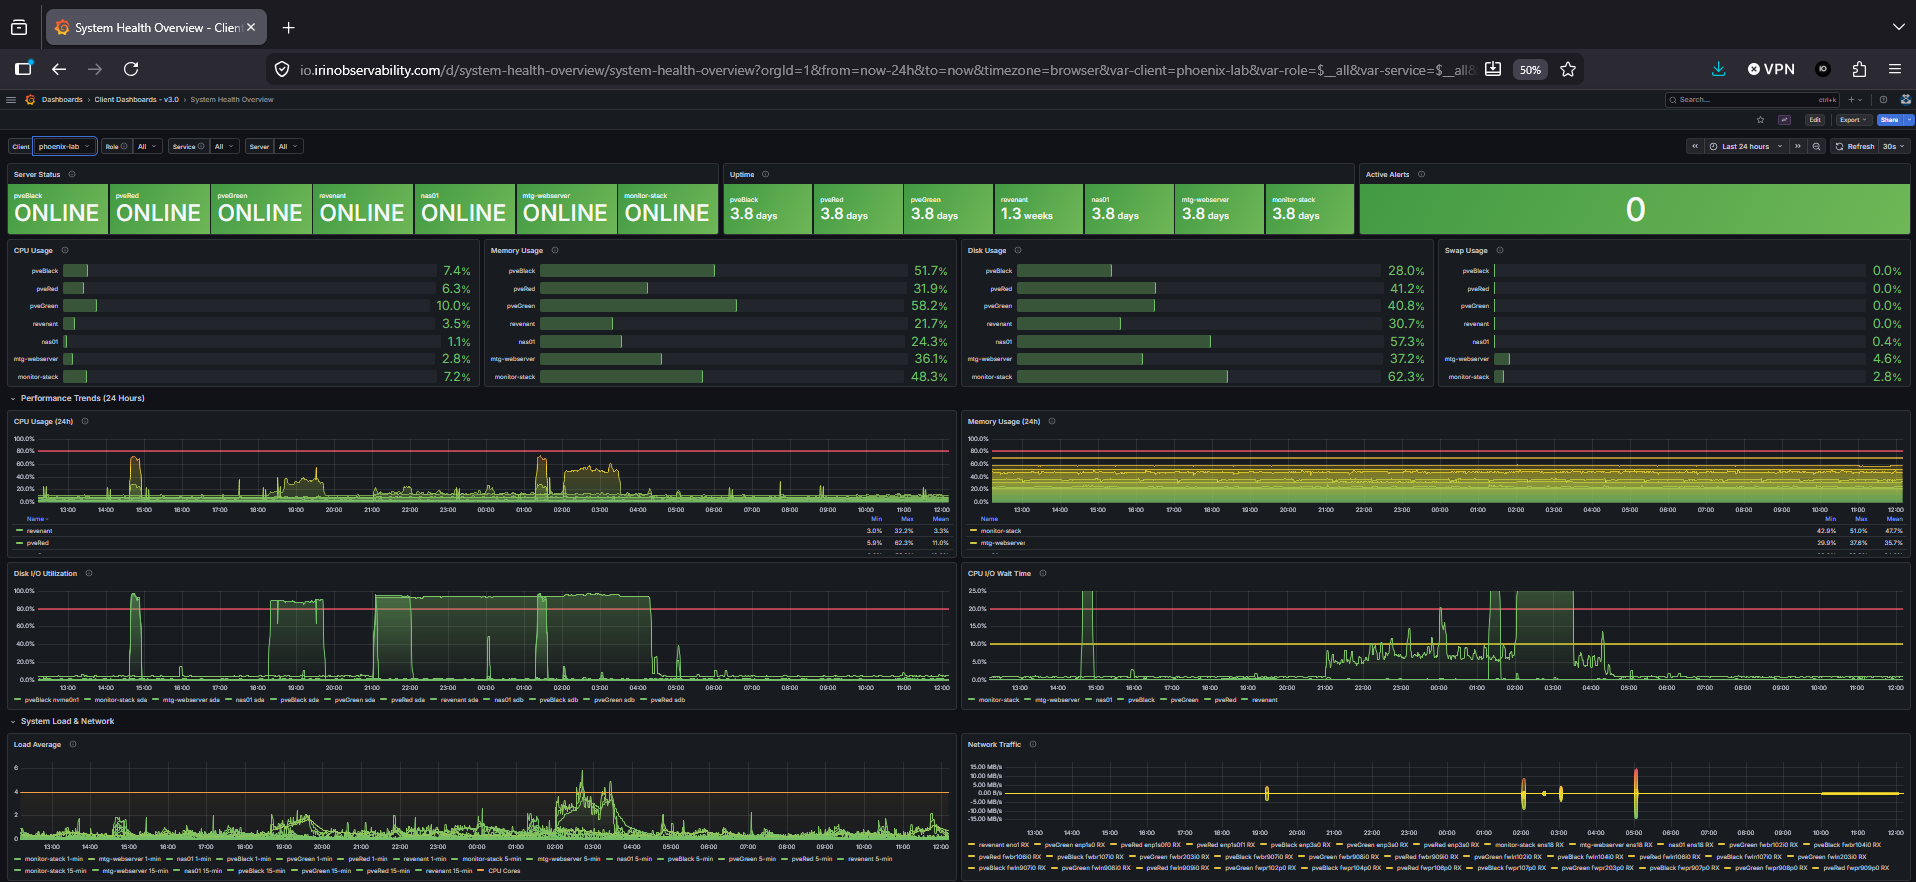
System Health Overview, per-server resource gauges visible only within the tenant’s own Grafana org
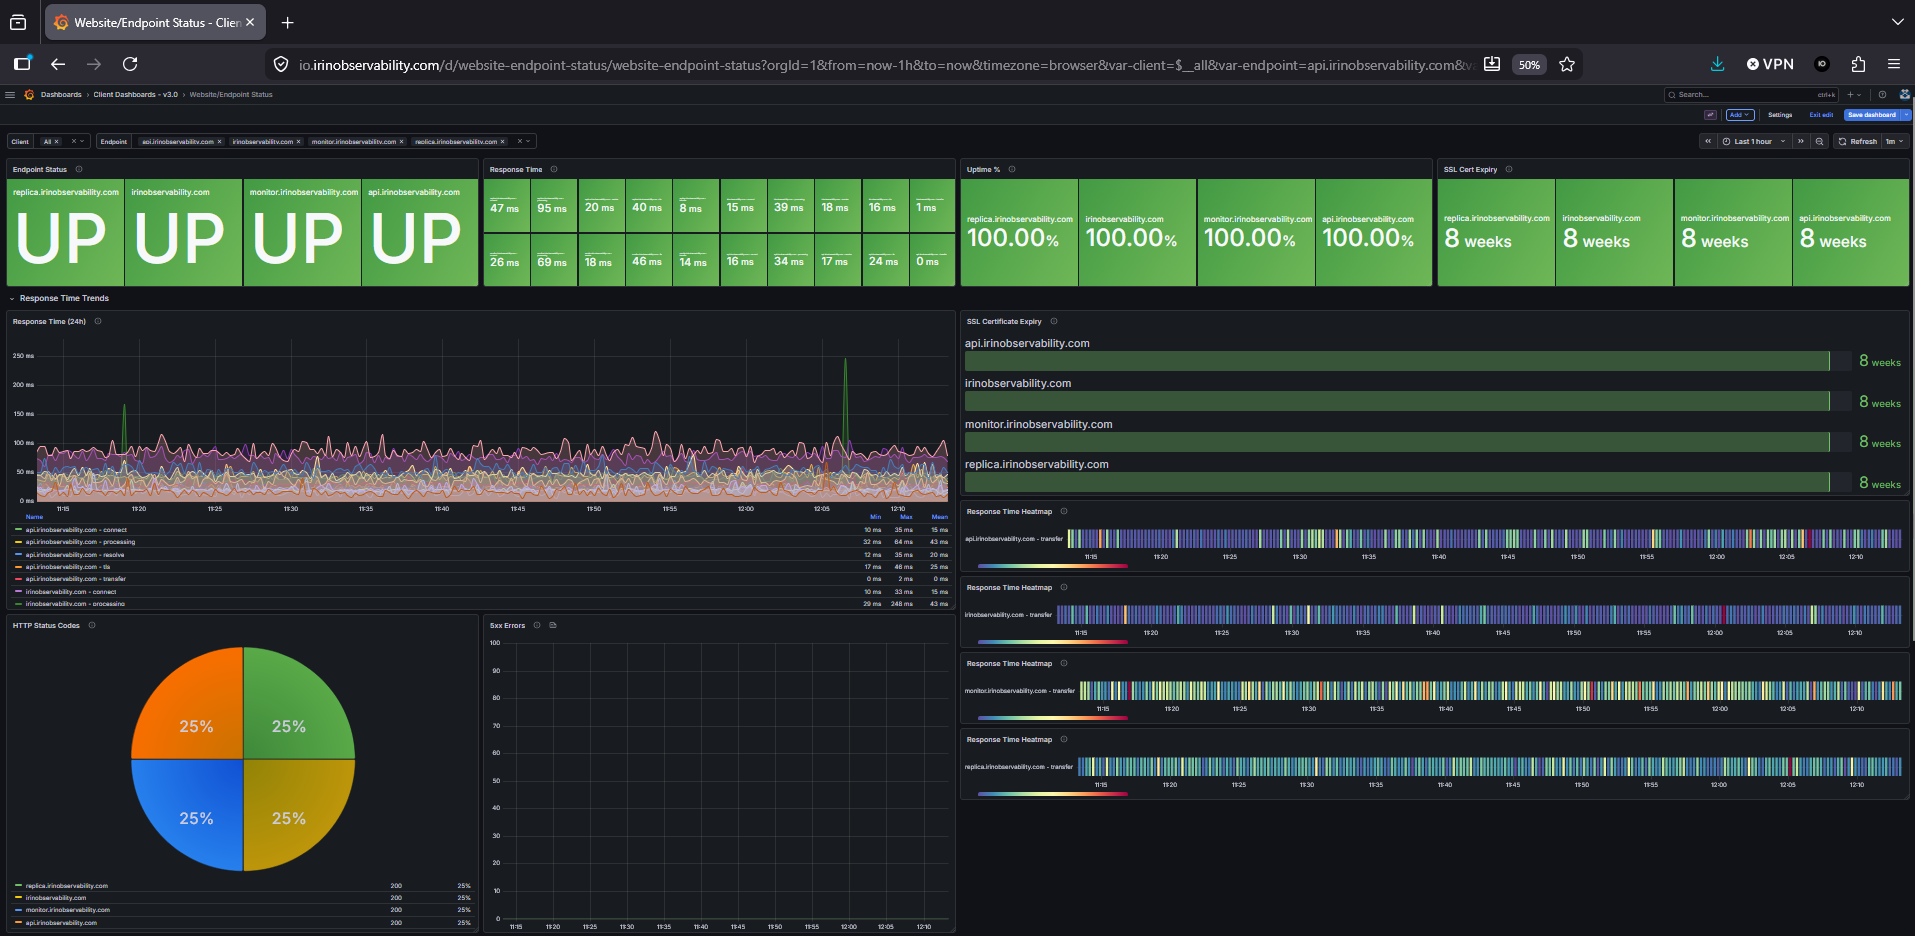
Website & Endpoint Status, uptime calendar and SSL expiry scoped to the tenant’s endpoints
I recently posted about multi-tenant observability and the most common follow-up question was some version of “but is that actually isolated?” So thought I’d elaborate on how I’m isolating tenants in my monitoring stack. The default mental model for multi-tenant isolation is dedicated infrastructure, with separate databases, separate servers, separate everything, so each tenant has its own stack. While that model is genuinely isolated, it’s also expensive to operate, complex to maintain, and for most small business use cases, more engineering than the threat model requires.
The level of isolation I’m trying to reach is “can tenant A read, write, or influence tenant B’s data under any normal operating condition, and does a failure in one layer automatically cascade into a cross-tenant breach?” I think that using this architecture, I’ve managed to reach that level of isolation.
// WHAT ISOLATION MEANS HERE
The threat model for a managed infrastructure monitoring platform is specific. Clients are pushing system metrics and logs like CPU percentages, memory usage, disk I/O, nginx access logs. The system doesn’t store sensitive information like payment data or medical records. The risk is a misconfiguration exposing one tenant’s data to another, a compromised client credential being used to push data under a different tenant’s label, and a decommissioned tenant retaining access after their contract ends.
I designed the isolation model around those risks.
// LAYER 1: PROMETHEUS LABELS
Every metric series in Prometheus is identified by a set of key-value label pairs. The tenant label scopes data to a specific client. For example: {tenant="acme-inc", instance="acme-svr01"} belongs to acme-inc and only acme-inc.
Alloy injects that label before the push, using a config file generated when the client server is registered. A client can’t mislabel their own series even intentionally because the label is baked into the Alloy config that’s controlled from the host server, not something the client provides at push time.
A hacker would need to either compromise the Alloy binary on the client host and modify its config file or find a way to push metrics directly to the remote-write endpoint with a forged label. Compromising the Alloy binary requires local access to the client server, at which point the attacker already has everything Alloy can see, so bypassing the label gains them nothing new. The Cloudflare Access layer is there to prevent the pushed metrics from being compromised.
// LAYER 2: GRAFANA ORGANIZATIONS
Grafana’s organization system creates completely separate namespaces within one instance. A user in org 26 isn’t able to see dashboards from org 27, can’t query data sources from org 27, and doesn’t know that org 27 exists. The separation is enforced at the application layer, it’s not a filter that can be toggled, it’s a hard namespace boundary.
Each tenant org has its own data source configuration with a preset label filter applied. Even if someone was able to query Prometheus directly through that data source by manipulating a dashboard panel’s PromQL, the data source itself has tenant="acme-inc" baked into its query parameters, so they’d still only see acme-inc’s data.
If a Prometheus label were somehow misconfigured or bypassed, the Grafana org boundary would still contain the breach. A user would need both a label-layer failure and Grafana org access to another tenant’s org to see cross-tenant data.
// LAYER 3: CLOUDFLARE ACCESS SERVICE TOKENS
Before any data reaches the servers, Cloudflare’s Access layer checks the service token in every push request. Each tenant has a unique token issued during account creation. Cloudflare’s edge rejects invalid or revoked tokens, and the request never reaches Nginx, Prometheus, or Loki.
Revoking a token is minimal effort, and a quick change in the Cloudflare dashboard or via their API. Prometheus’s configs don’t change, and the Docker containers can stay running. A decommissioned tenant is cut off immediately without any delay.
In the current model all servers that are owned by each tenant share one token. A compromised token exposes one tenant’s push capability, not any other tenant’s. In the future, I’d like to implement per-server tokens, where a compromised token exposes one machine rather than one organization, which tightens up the blast radius considerably.
// WHY INDEPENDENCE BETWEEN LAYERS MATTERS
I’m relying on the independence of each layer to keep the clients safe. If the label layer failed, the Grafana org layer would still contain it. Any misconfigured data would land in Prometheus under the wrong label, but the tenant’s Grafana org data source still has its own label filter applied. The tenant would see missing data, not another tenant’s data. The failure would surface as a monitoring gap, not a data breach.
If the Grafana org layer failed, and a Grafana bug allowed a user to query another org’s data source, the label layer would still scope the query. The data source might be accessible, but the data it returns is still filtered by the tenant label. Cross-tenant data exposure would require both a Grafana org bypass and the ability to issue arbitrary PromQL without the label filter.
If the Cloudflare Access token layer failed, and a token was leaked and used by an unauthorized party, they could push metrics to the ingestion endpoint, but only under that tenant’s label, and they wouldn’t be able to push data that appeared under another tenant’s label. They also can’t read any data because the Cloudflare token controls push access, not read access. Read access is controlled by Grafana org membership.
// WHAT THIS DOESN’T PROTECT AGAINST
A full compromise of the monitoring server exposes all tenants’ metrics and logs. This is the most significant risk and it’s mitigated by the standard hardening measures. Admin accounts all have MFA, there are no inbound ports except through the Cloudflare tunnel, and automatic security updates are enabled.
Label and org isolation is defense-in-depth, and it relies on correct implementation of Prometheus label scoping and Grafana’s org system. Both are well-tested in production on a significant scale.
// WHERE THIS GOES NEXT
Per-server Cloudflare tokens are the most concrete near-term improvement, but will take a lot of time and energy to develop.