I built a managed observability SaaS from a homelab. I still couldn’t explain what was happening.
May 7, 2026 · By Justyn Larry
I had dashboards. I had logs. I still didn’t know why things were breaking.
When I first found the Prometheus-Grafana stack, I was entranced. I could see what my homelab was doing. What server was running hot, how much memory it was using, CPU usage, everything. I went down the rabbit hole of creating, modifying, and ricing my dashboards. I’d get an idea and build it. Why not? I need to know what’s going on, right?
At some point I had one giant dashboard that I had to scroll endlessly to see all the metrics I’d started tracking, and something became painfully clear: I didn’t need to track everything. Because I had pages of metrics, things would go wrong before I’d notice anything on the dashboards. I’d created a beautiful, chaotic mess, not a real tool that could inform. On my path to the answer, I made quite a few more mistakes along the way.
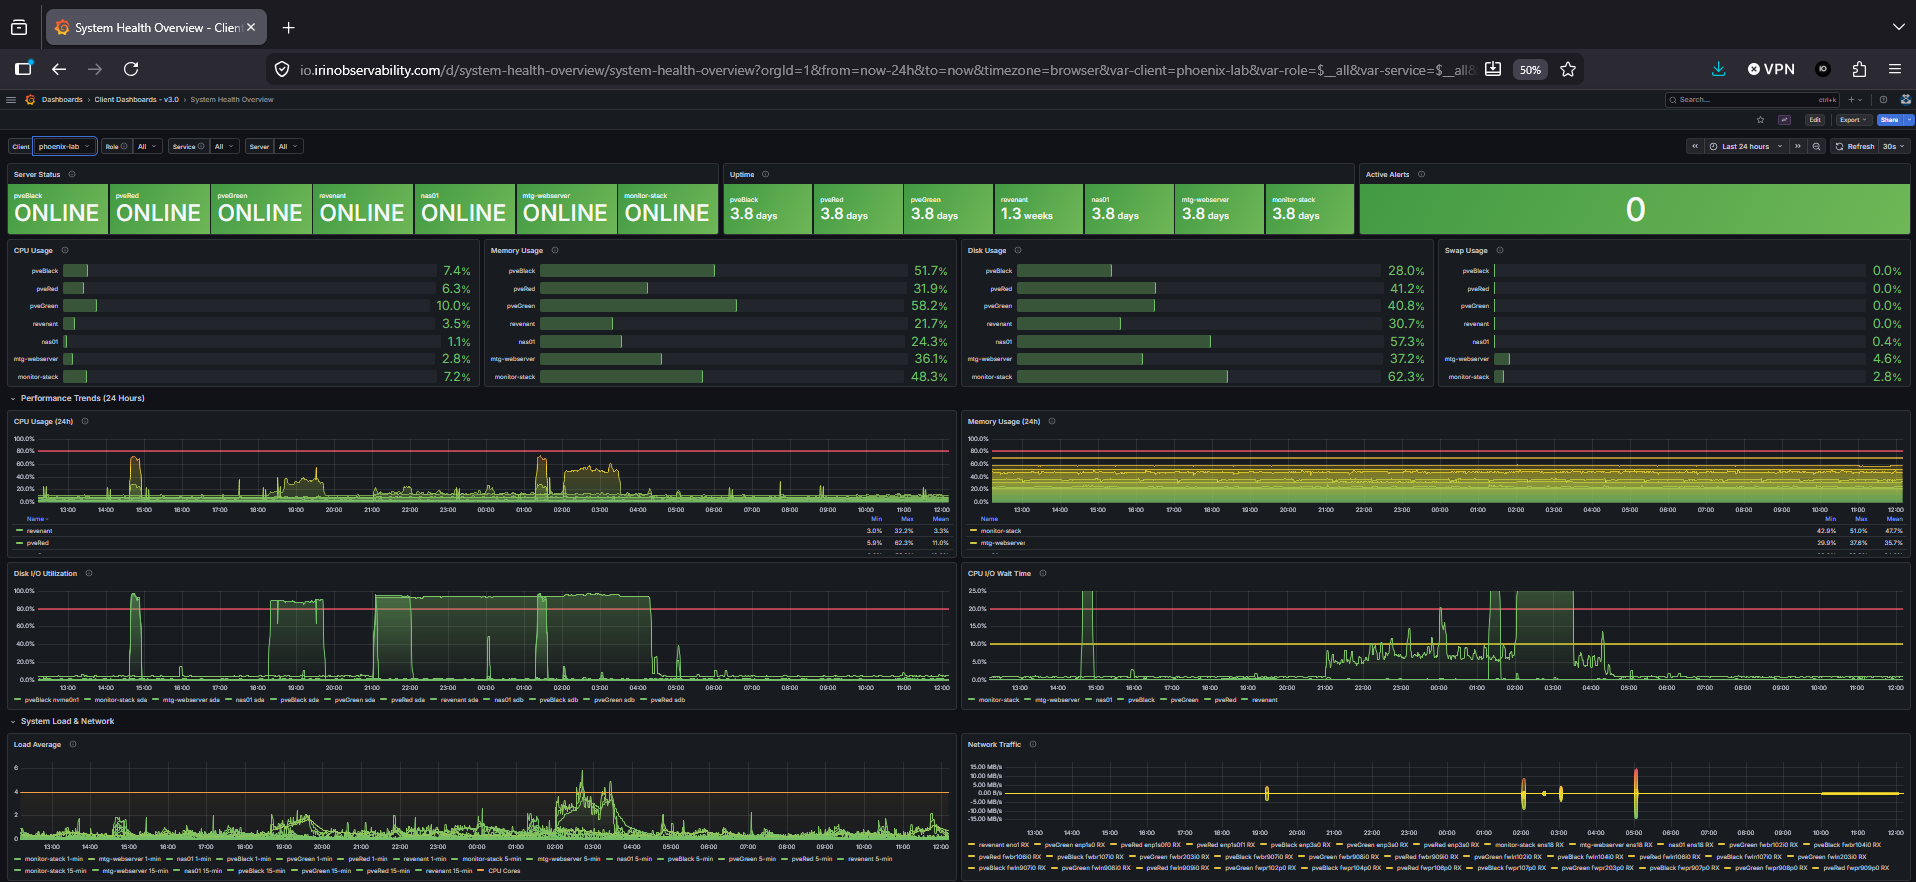
the cleaned-up version. The original was much worse
One of the biggest problems I faced was isolating different environments. I had virtual machines mixed with Proxmox nodes, mixed with bare metal servers, all running different services and serving different purposes. I couldn’t find clarity because I hadn’t organized any of it properly from the beginning. I did some research and planned out a second iteration: an Elastic Stack for logs on its own machine, a new VM just to monitor the monitoring stack. That resulted in a ridiculous amount of resource overhead and far more information than I needed. Nothing was broken, but it still wasn’t working, and I couldn’t trust any of it.
That’s not to say the solutions I tried were wrong. They just weren’t right for my environment. The cost was too high. Monitoring tools don’t fail loudly. They have a tendency to degrade your ability to make sense of them by creating more noise than actionable data. Worst of all, I was spending more time keeping an eye on the monitoring stack than the dashboards it was producing.
That’s when I started thinking seriously about monitoring as a platform for small businesses. I just wanted to see what my homelab was doing and had already spent a massive amount of time trying to get it configured properly. If that was true for me, someone who genuinely enjoys this, what must small businesses be going through? They’re trying to build a product, and now they have to allocate resources to build and maintain an entirely separate system just to know if it’s working.
My original idea was completely overblown. Managed observability as a retainer, with setup fees, on-call windows, incident postmortems, and quarterly reviews. I was dreaming big. This is something I love doing, I can put in the hours, I can make it work. After looking at the numbers I realized there was no way I could handle all of that alone, no matter how hard I worked. The pricing would have had to be outrageous, and then the obvious question becomes: why not just use a large company that’s already established?
I’m not going to lie, I was a little crushed. I had a plan and I thought it was a good one, but it wasn’t realistic. This had to be a flat-rate advisory service, with no remote access and no on-call. What I didn’t expect was that stripping the model down actually made the technical side cleaner. I could design dashboards that were segmented and easy to read, informative enough that the end user could look at them and immediately know whether everything was fine or something needed attention.
When I built my first stack it used Prometheus’s node-exporter, which worked great on my local network. Everything ran through the same switch, security concerns were minimal. Once I started thinking through the client side I realized it would be an absolute nightmare. For starters, I couldn’t reach their servers to pull metrics or logs, and I’d be asking them to open ports in their firewall. This was supposed to make their lives easier. They should be doing next to nothing to get monitoring up and running on their end. The answer was Grafana Alloy with a Cloudflare Zero Trust tunnel.
With this setup I’d have to ask for almost nothing. The client enters their server information in a web portal and runs a single curl command. Alloy installs itself, and all their data is encrypted end-to-end. I could even add mTLS for extra security. I thought that was the right call, so I built out a full step-ca certificate authority and configured mTLS between components. It almost worked.
The problem wasn’t that it broke. The problem was how it broke. After a Grafana restart or an admin account recovery, stale mTLS settings would quietly linger in the datasource configurations. No loud failure, no clear error. Just dashboards showing nothing, and a datasource that looked fine until you dug into it. It looked like a data gap, not a certificate problem, and it wasted a lot of time.
I ripped it out entirely. External access now goes through Cloudflare tunnels, and internal container communication runs on plain HTTP inside the Docker network. Nobody outside the host can reach it, and I can verify the state of any connection in seconds. Complexity you can’t quickly verify becomes a liability exactly when you can least afford it. Simplifying that layer is what made everything else stable.
These aren’t all the mistakes I made along the way. All of them stung a little and tried to undermine my confidence. Persistence paid off, and for today, it’s all working.
// HERE’S WHERE THE STACK SITS TODAY
Two Lenovo ThinkCentre M75s running as primary and warm standby. The stack is Prometheus, Grafana, Loki, Alertmanager, Grafana Alloy, MinIO, PostgreSQL, Nginx, cAdvisor, Blackbox Exporter, and Cloudflare tunnels holding it all together. PostgreSQL handles the portal database and streams replication to the replica. Alloy on every client server pushes metrics and logs to both nodes simultaneously, so the standby has live data at all times. The setup is mirrored on a dev server used for major stack upgrades before anything touches production.
Client onboarding is a single bootstrap command. The agent installs, registers with the API, and starts pushing outbound. No inbound ports, no SSH, nothing reaches into the client’s network. Tenant isolation runs at three independent layers: Prometheus labels injected at registration time, separate Grafana organizations per tenant, and per-tenant Cloudflare Access tokens that can be revoked in seconds.
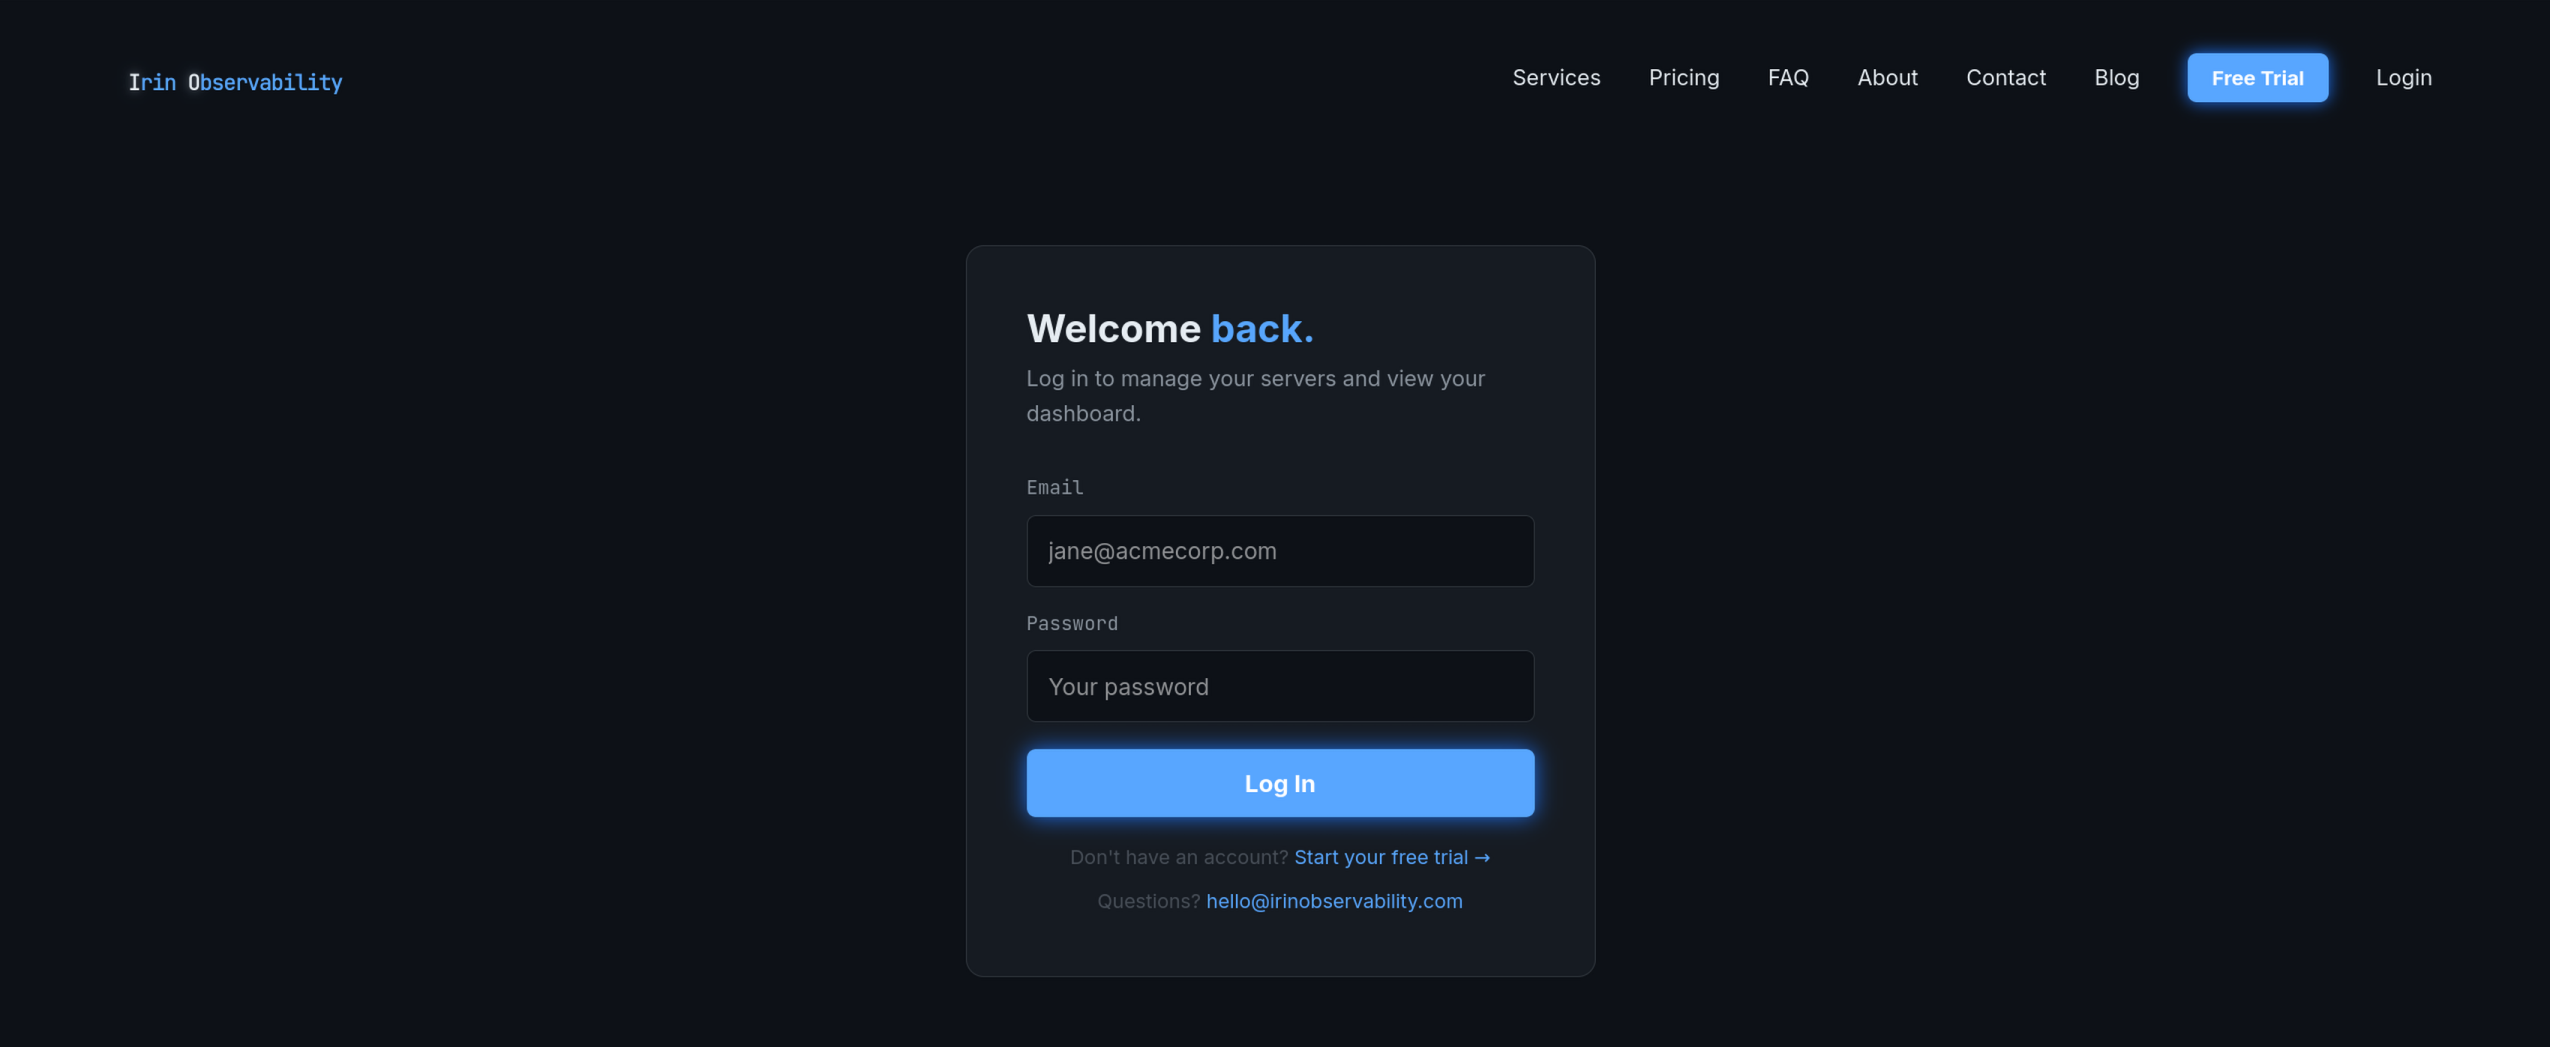
the client portal, where tenants land after onboarding
The portal is a Python Flask API with a multi-user frontend per tenant. Full onboarding and offboarding is scripted. Right now there are about 14 servers across four tenants running on it.
It’s genuinely exciting to see it running, from a single VM experiment to something that actually serves clients. But it’s not close to finished, and it probably never will be.
// PHASE 2: BEFORE IT SCALES
Each tenant currently shares one Cloudflare token across all their servers. A compromised token affects all of that tenant’s machines. Per-server tokens would shrink that blast radius down to one machine, and that change needs to happen before any enterprise clients come on board.
Stripe is integrated but the webhook to provisioning automation isn’t built yet. Paid signups currently have a manual step in the middle. That gets replaced with automated provisioning in Phase 2, along with bulk onboarding via Ansible for clients bringing in more than a handful of servers at once.
Grafana login tracking per tenant and an inactive tenant nudge via Resend are also on the list. Right now I can’t tell who’s actually logging in. For a product where engagement is a leading indicator of retention, that’s a gap worth closing.
// PHASE 3: WHEN THE SCALE ACTUALLY CHANGES
The current Docker Compose architecture is the right call for now. It’s simple, debuggable, and doesn’t need a Kubernetes operator to keep it running. That changes when the tenant count justifies it.
Client-side Kubernetes monitoring is on the horizon, kube-state-metrics, kubelet, pod dashboards, but there are enough pressing concerns without standing up a full test environment for something nobody has asked for yet.
Off-site DR is the item I think about most. Both nodes are in the same location right now. A third server off-site with Prometheus remote_write and Loki forwarding over Tailscale would close that gap. SOC 2 attestation is something I’m consciously building toward, but the audit cost has to be justified by revenue, and being close to compliance is the current benchmark.
I’m not writing this to show how far the project has come. The mistakes are more useful than the wins, and most of them were obvious in hindsight.
If you’re building something similar, or you’ve been through your own version of this: what’s the mistake that took you the longest to admit was actually a mistake?