Know when your servers need attention before your users do.
Managed Linux server monitoring built on Prometheus, Grafana, and Loki. Up and running in 60 seconds.
Start Free. Up to 3 Servers.Outbound-only agent. We never access your servers.
What your team actually sees
Infrastructure problems are expensive. Most are preventable with early warning.
One command installs the agent. Run it on any Linux server.
CPU, memory, disk, network, and logs visible within minutes of install.
Alerts fire when something actually needs attention.
Free tier covers up to 3 servers. No credit card required.
Paid plans include a monthly infrastructure health report — plain-English analysis you can hand to a manager.
What you get
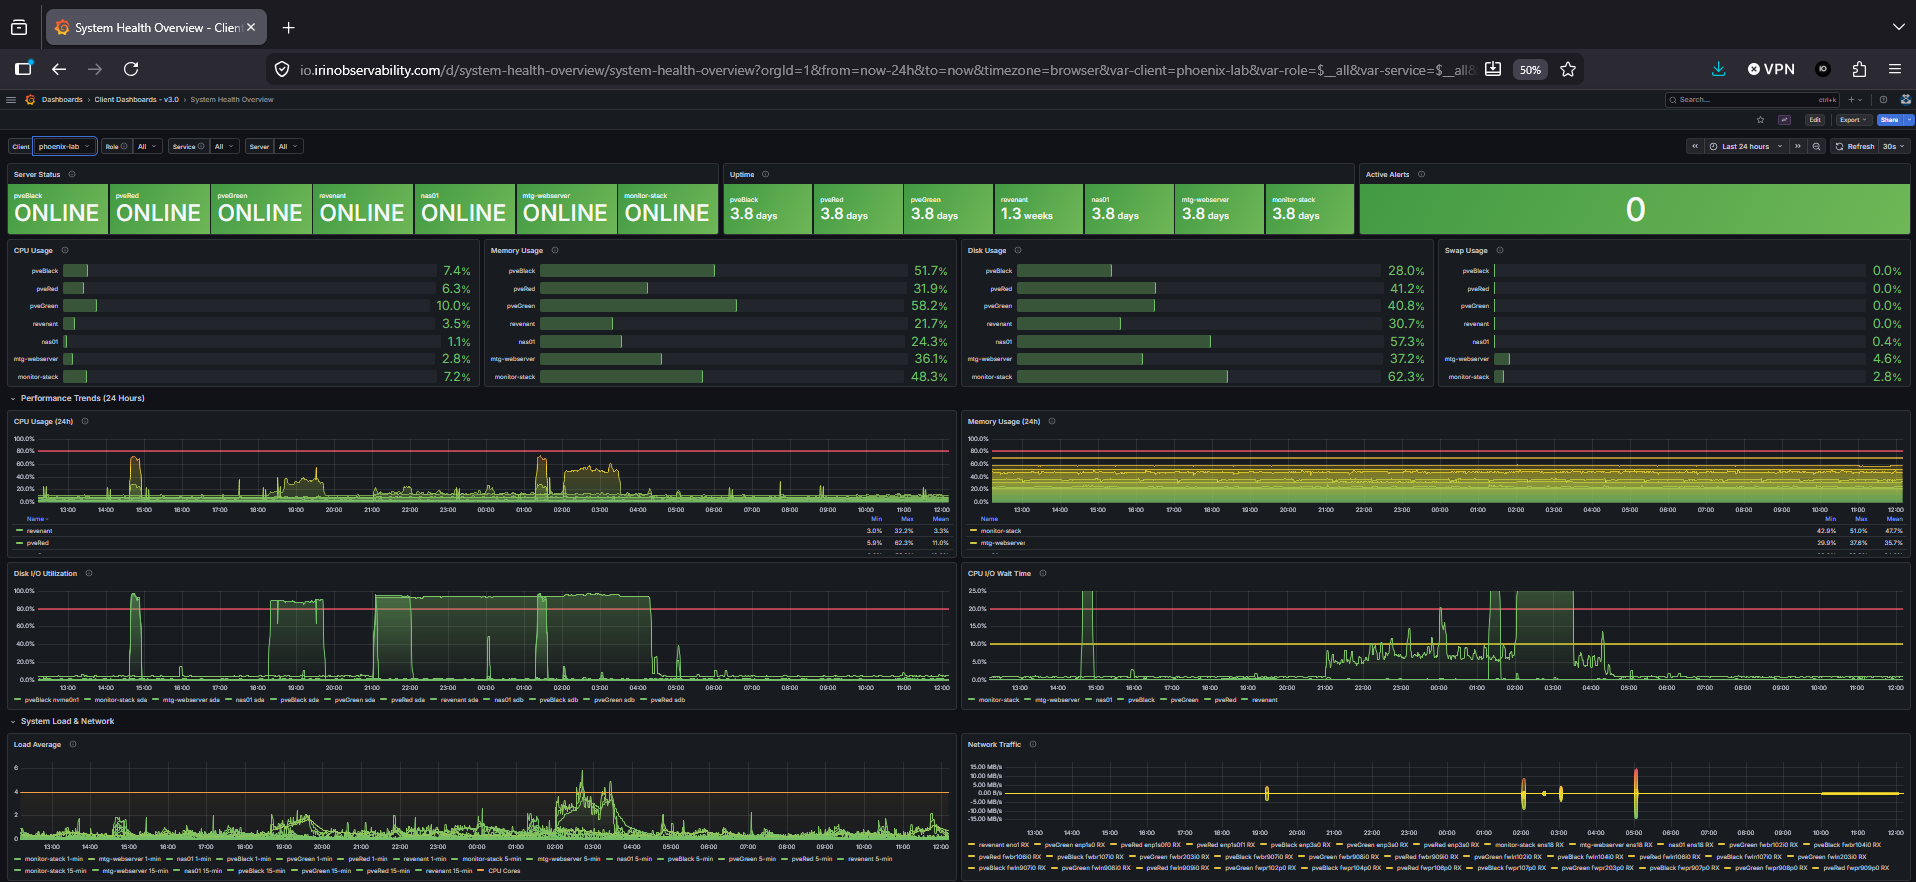
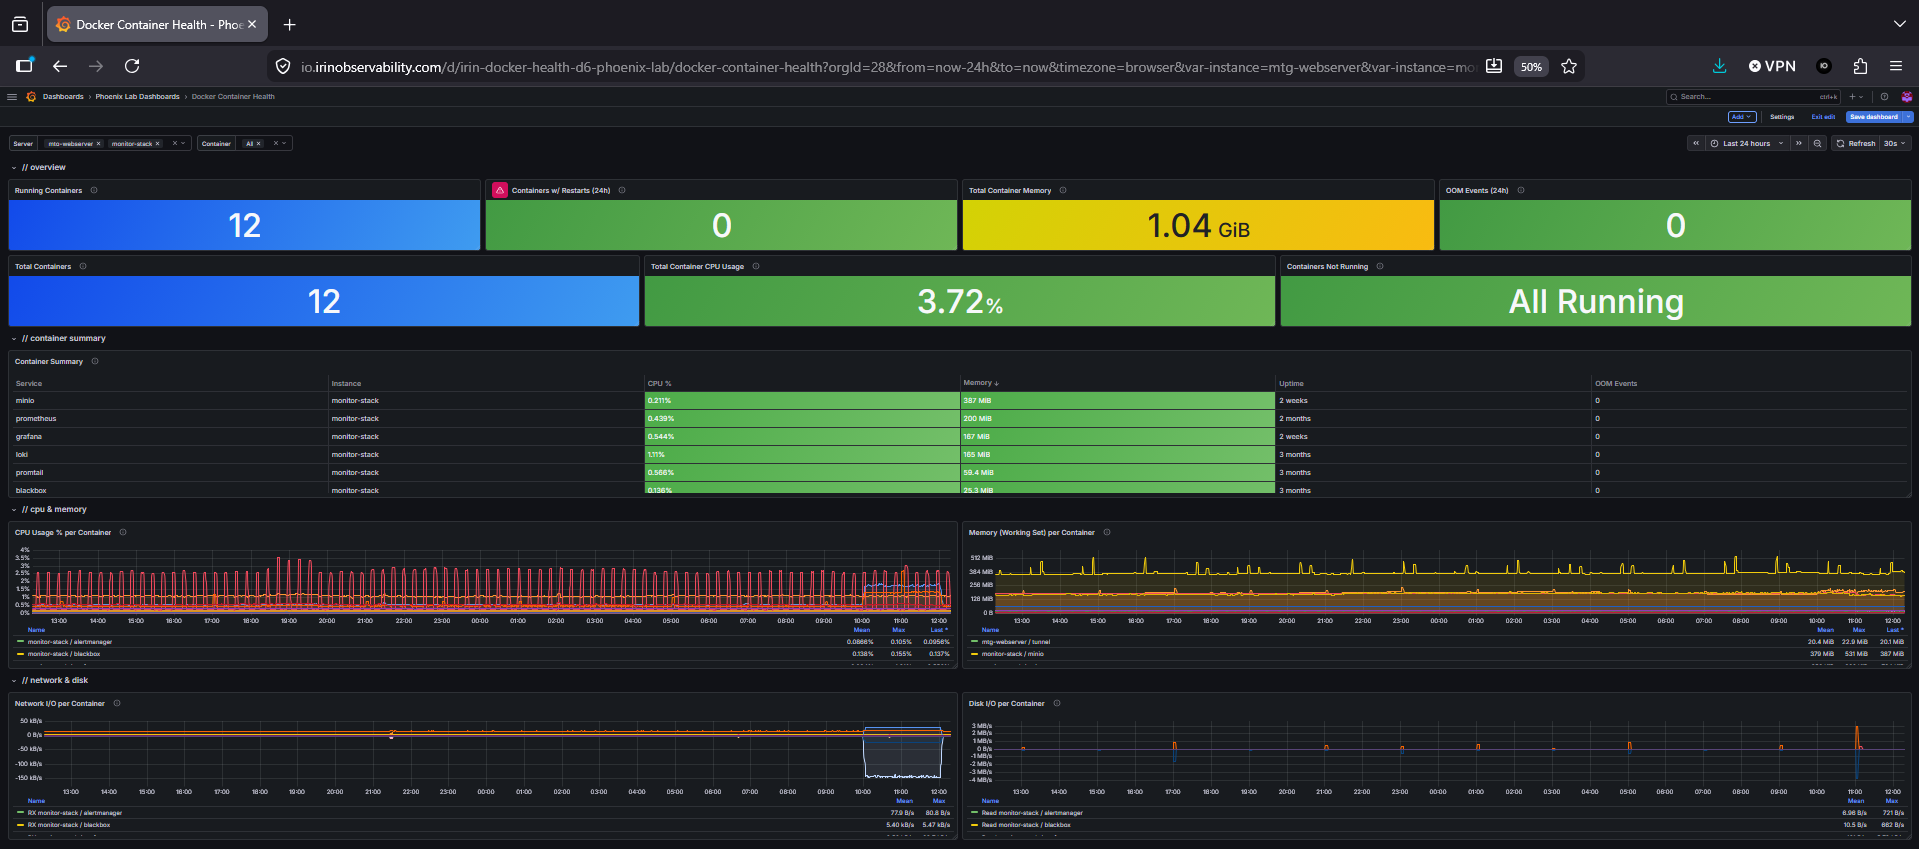
Metrics
CPU, memory, disk, and network dashboards are available on all tiers. These are prebuilt and start populating as soon as the agent connects. Docker monitoring is available on the paid tier.
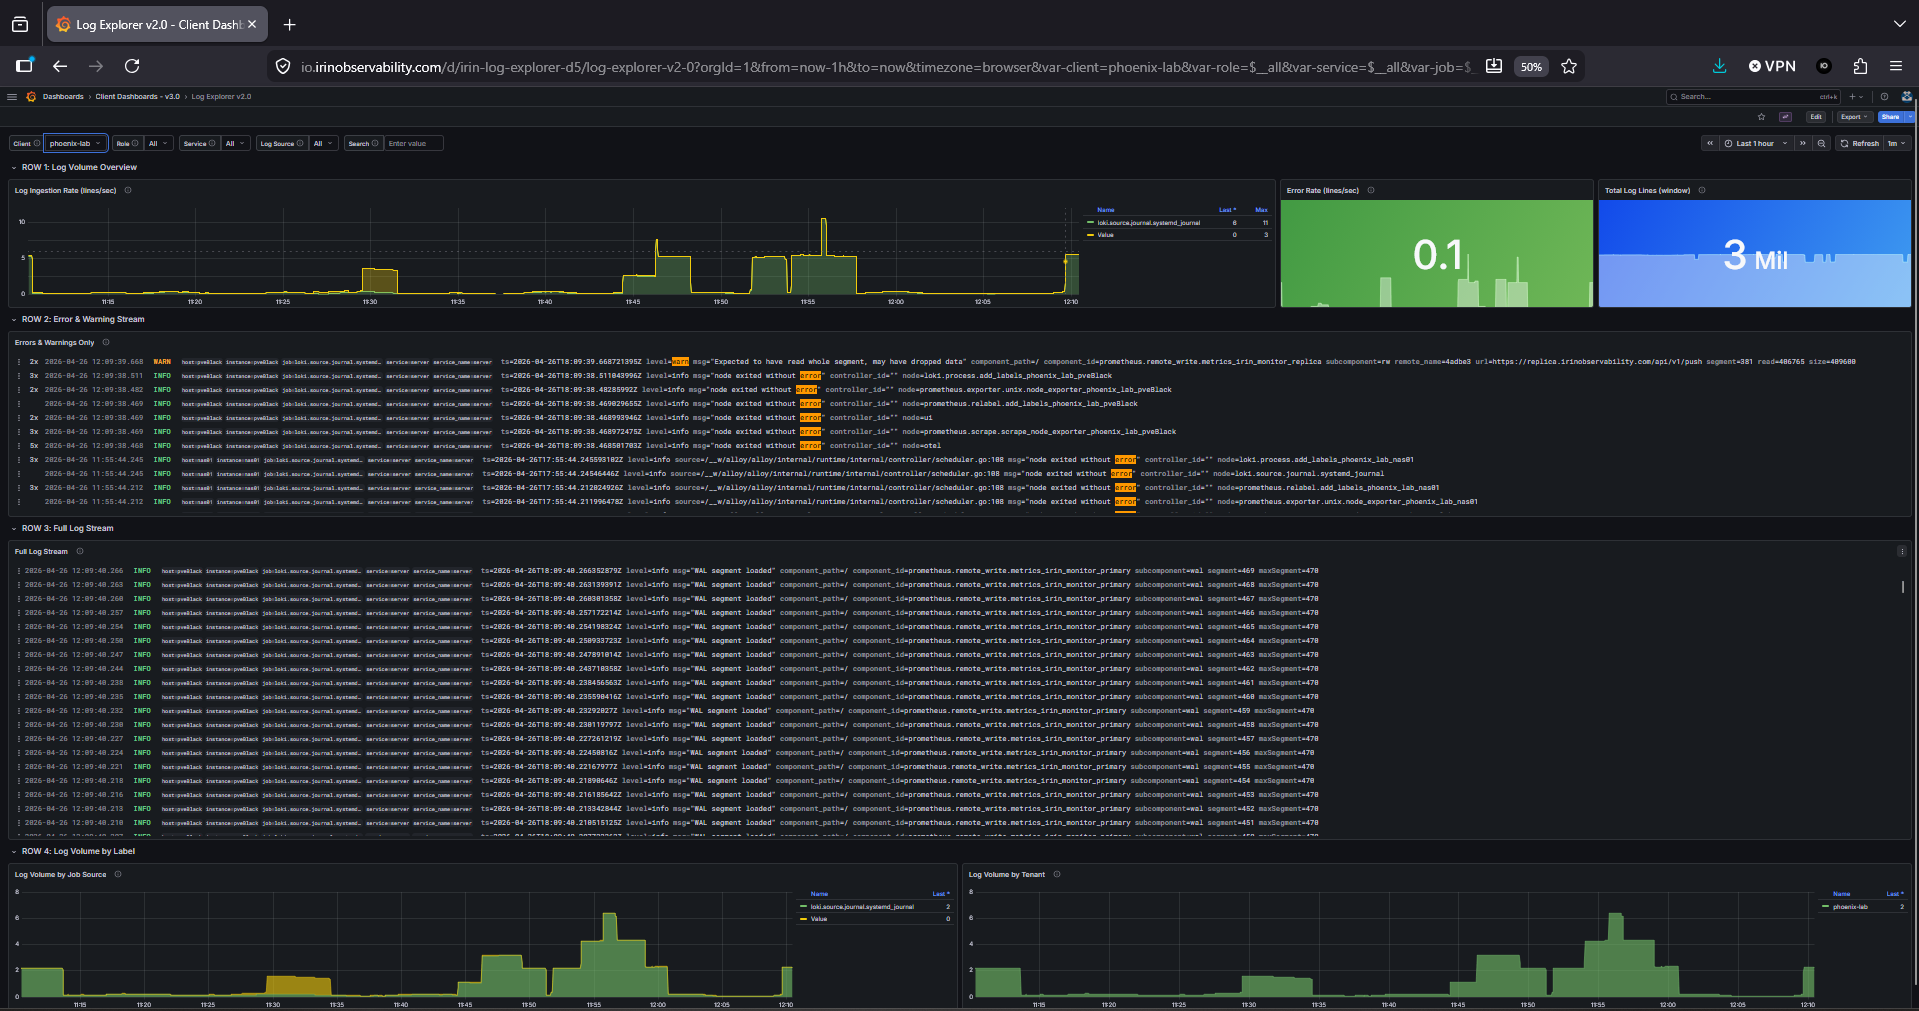
Logs and Ingestion
Structured, queryable logs across all servers with real-time filtering and search. See errors as they happen and track which services generate the most data.
Alerts
Alerts combine metrics and logs to focus on actionable issues, not raw thresholds. Slack and email delivery on paid plans.
What makes us different
No Inbound Access
Your servers push data outbound. Nothing connects into your infrastructure.
Two Backends, Always Live
Each server sends data to both systems. If one of our servers fails, the other already has current data.
No Usage-Based Pricing
We don't charge for how much data your systems produce.
Isolation Without Separate Stacks
Your data is never mixed with another customer's, enforced at three independent layers: ingestion, visualization, and access control.
How it's designed
No Remote Access
We never access your servers. The Alloy agent pushes data outbound through an encrypted Cloudflare Zero Trust tunnel. No inbound access and no firewall changes required.
No Personal Data
We collect system metrics and logs: CPU, memory, disk, network. We do not collect application data or user information.
Your Data, Isolated
Each customer is isolated at multiple layers: ingestion (labels), visualization (Grafana organizations), and access (Cloudflare tokens). A failure in one layer doesn't expose another tenant's data.
How it's built
Your servers run a lightweight Alloy agent and push metrics and logs outbound through a Cloudflare Zero Trust tunnel to two independent backends, each running Prometheus, Grafana, and Loki. No inbound ports are opened and there is no per-GB billing layer in between. What began as a homelab experiment to solve tenant isolation on one stack now runs as a managed service with the same architecture.
Collect
Alloy runs locally and gathers system metrics and logs.
Transmit
Data is pushed outbound through an encrypted Cloudflare Tunnel. No inbound access required.
Visualize
Your Grafana instance is pre-configured with dashboards and alerting tied to your servers.
Built on open standards. View our public repository.
Why Irin?
In Aramaic, irin means watchers, beings who observe without interfering. The root word means to be awake. That is the role monitoring should play: present, invisible, and never doing anything beyond what you have authorized. Read more on our About page.